Creating Custom Reports for Data and Analytics
For any event planner, data and reporting is an important element when reconciling or analyzing their event. Thankfully in PheedLoop, we have a powerful, flexible reporting system that allows you to generate reports on virtually any dataset - in real time! Our Custom Reports feature is an improvement to our previous default reports where you can now choose the individual fields you want to be shown in each data report. With any event, pre-built reports are already included in the dashboard such as the Registration Data Report or the Ticket Purchase Data Report.
- There are over 40 report types with hundreds of field types to select from
- Various filters exist for reports such as Start Date/End Date and Targeting Specific Sessions or Exhibitors among others
- Reports can also be viewed immediately
- inside of the dashboard by clicking into any report > Blue Action Button > View.
- Larger reports can be generated in the background by clicking Blue Action Button > Generate Report. You will receive a notification when the report is ready for download.
Select your Custom Report:
- Attendees Report
- Registrations Report
- Session Checkins Report
- Gamification Report
- Virtual Event Attendance Report
- Payments Report
- Ticket Purchases Report
- Refunds Report
- Product Purchases Report
- Transactions Report
- Promotion Reports
- Proposal Reviews Report
- Proposals Report
- Proposal Reviewers Report
- Sessions Report
- Session Chat Data Report
- Polls Report
- Poll Responses Report
- Session Q&A Report
- Session Registrations Report
- Session Virtual Attendance Report
- Donations Report
- Tables Reports
- Form Responses Report
- Meetings Report
- Membership Transaction Reports
- Exhibitor chat Data Reports
- Exhibitors Report
- Sponsors Reports
- Exhibitor Leads Report
- Exhibitor Virtual Attendance Report
- Form Responses Report
- Session Speakers Report
Create Your Custom Report:
- Navigate to Data and Reports > Custom Reports
-
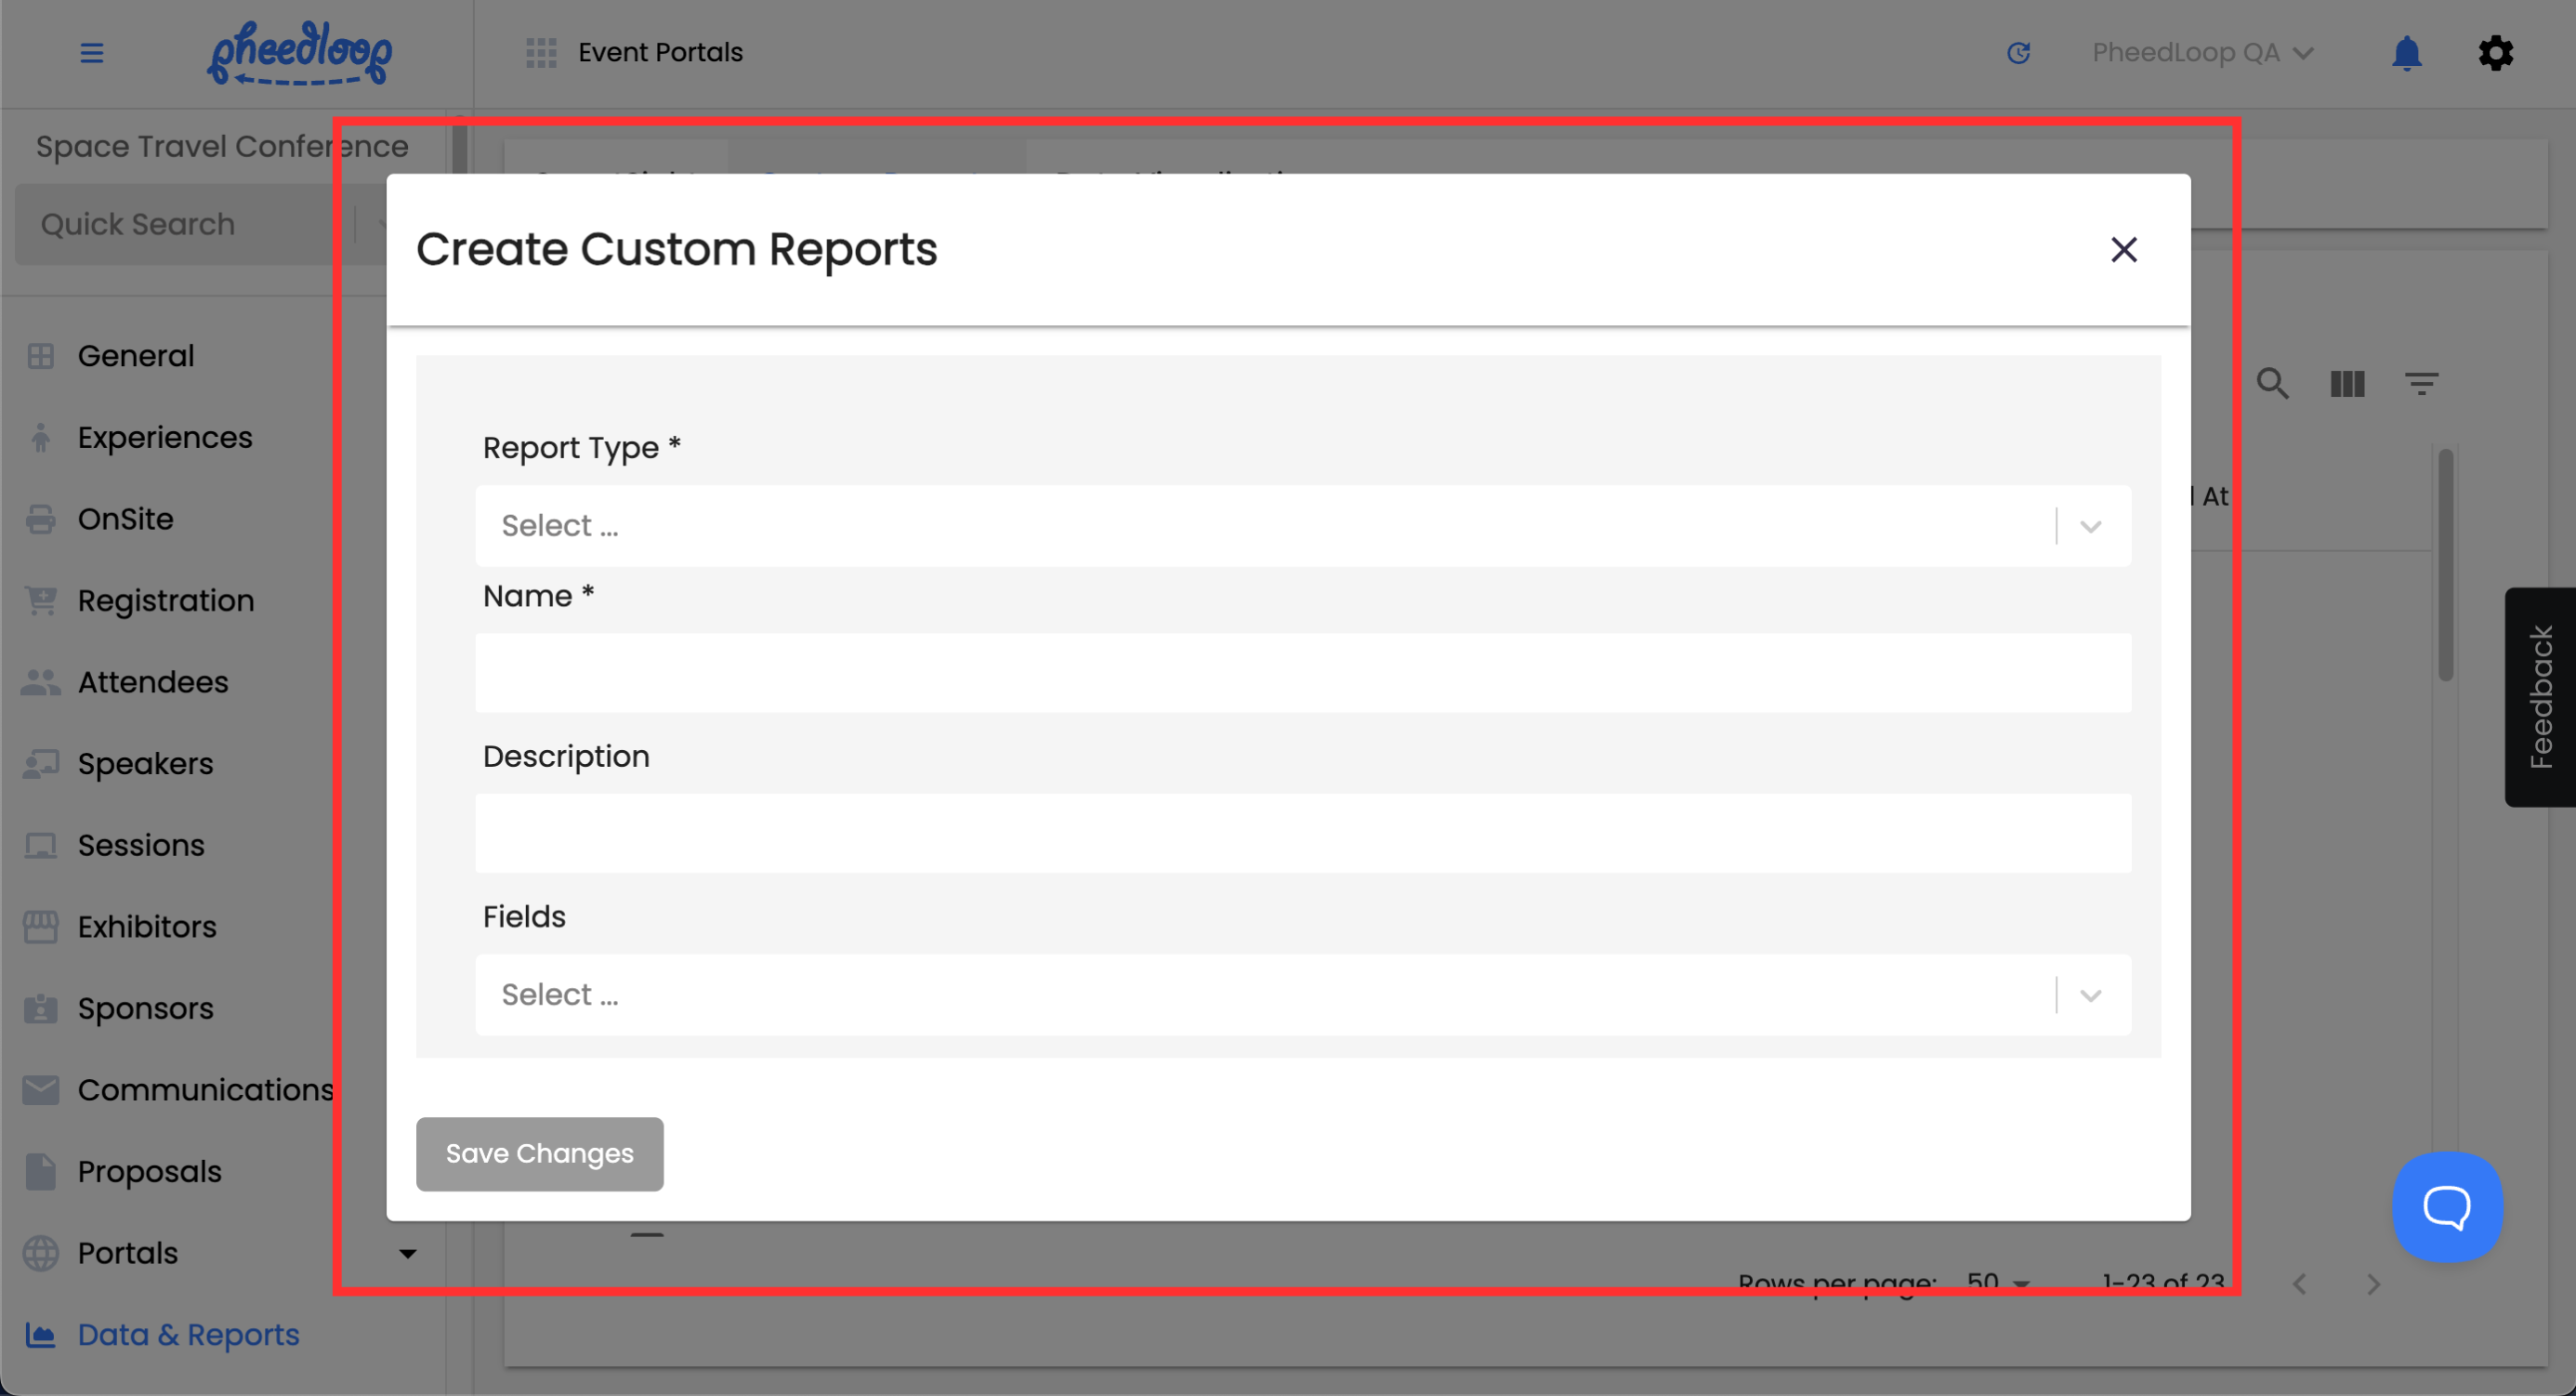
Above the Reports table, select Create

- Select your Report Type. Name the report, optionally add a description.
- Click into the Fields dropdown and select the fields you want populated inside of this report.
-
Select Save Changes


Now that your report is created, you will want to generate the report in order to download it.
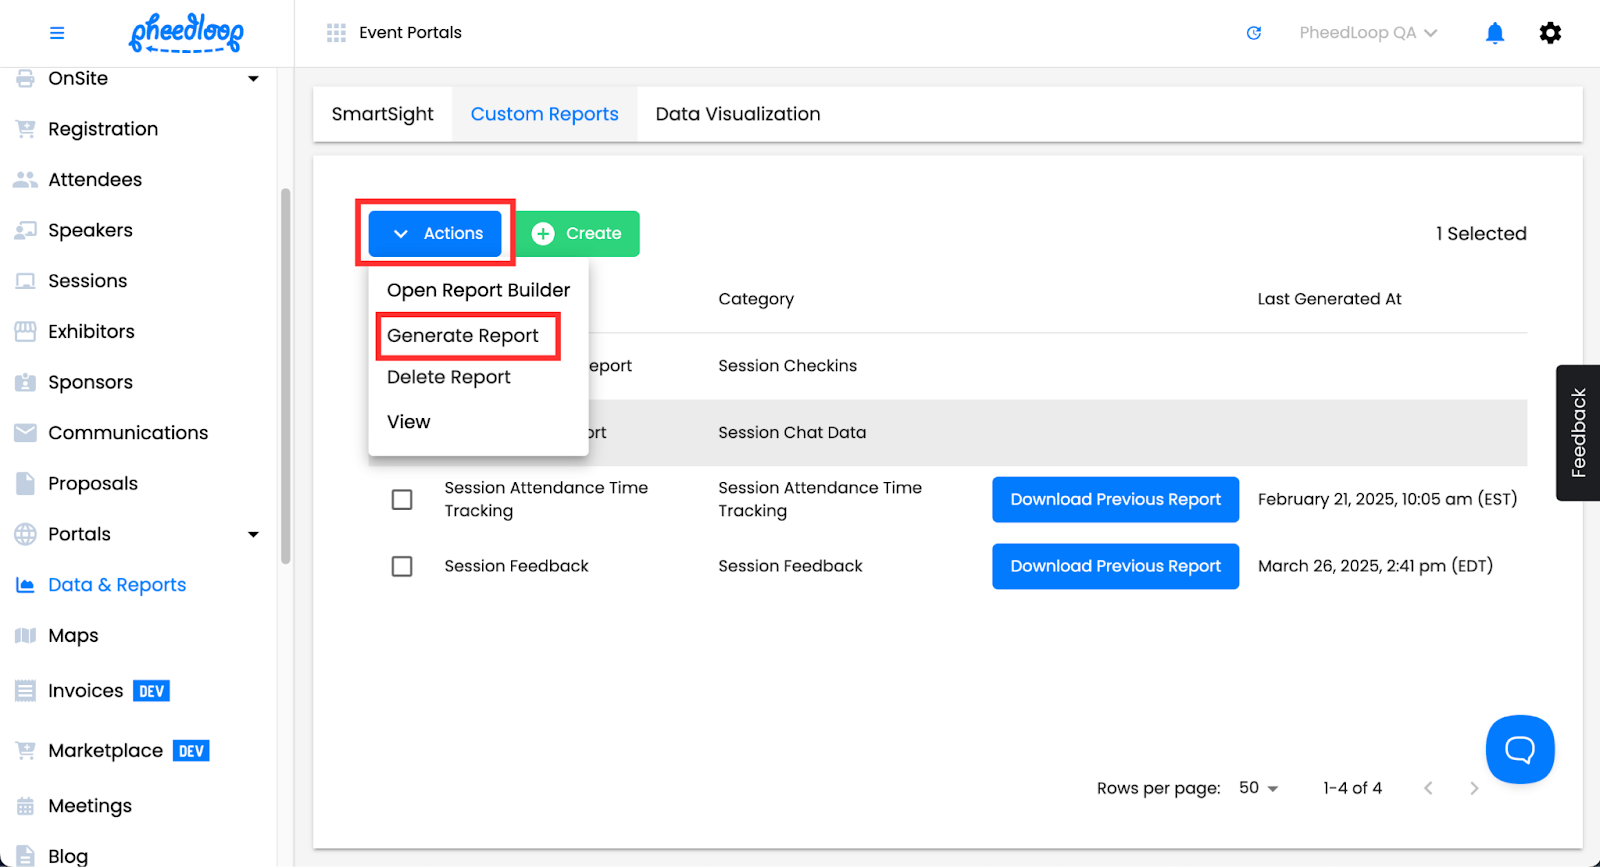
- From the data table, select the newly created report
- Above the Custom Reports table, select Actions > Generate Report.
- Alternatively, you may select Actions > View to view the report inside of the dashboard.
- Select Actions > Open Report Builder if you would like to further edit your report. For more information, please review our Using the Report Builder article.
-
Refresh the page and select Download Previous Report
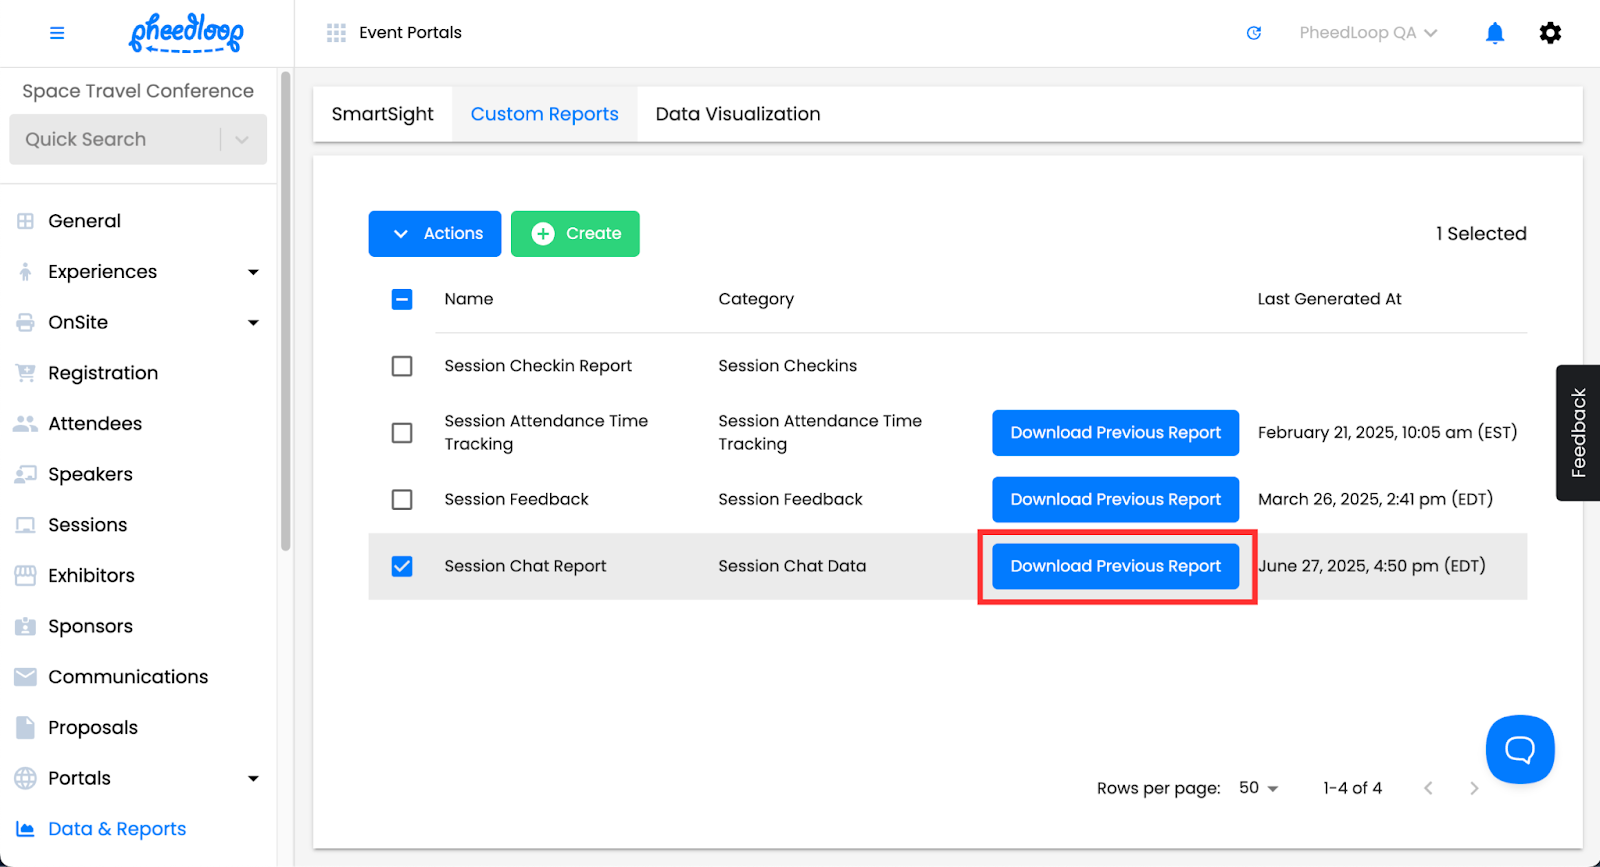
The report will automatically download in your browser. Additionally, a Download Previous Report button will be visible once the report is ready. You can always click back into this button to download the last generated version of this report.